Blog VLG Capital

Walk Forward Strategy Optimization

Walk forward optimization is step-by-step optimization over a time when trading strategy is optimized with in-sample data and collect out-of-sample performance.
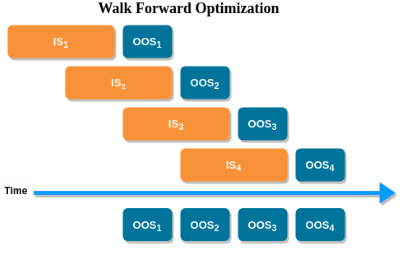
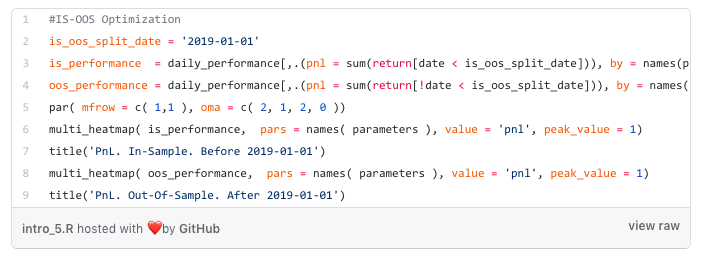
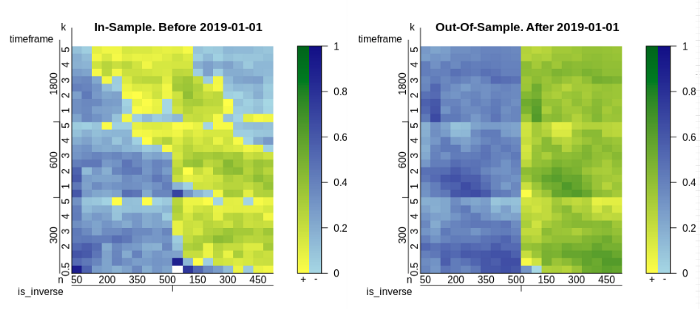
It is really necessary to test strategy by using walk forward optimization to get sustainable performance statistics of a strategy. For example, standard IS/OOS (In-Sample/Out-Of-Sample) optimization is just a 1-step Walk Forward Optimization. IS/OOS gives you bias performance because it only depends on IS and OOS performance and you have a high probability of overfitting and to escape it you can apply Walk Forward Optimization.

So, let’s turn to the example. I use package called QuantTools to load market data from Yahoo, Google and Finam data sources; implement trading strategies in C++11; backtest them and visualize results using additional useful tools of the package.

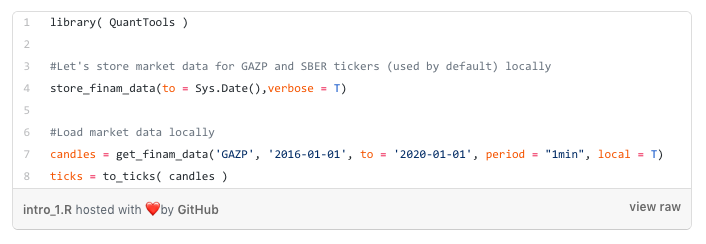
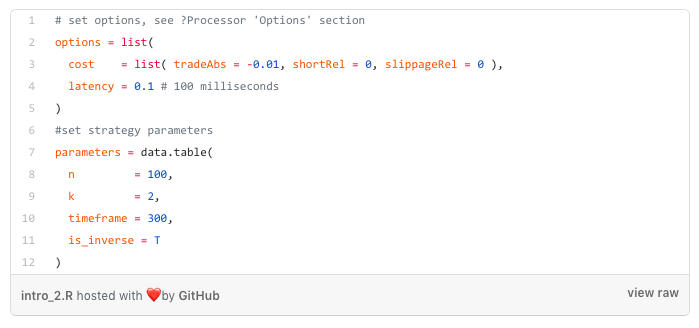
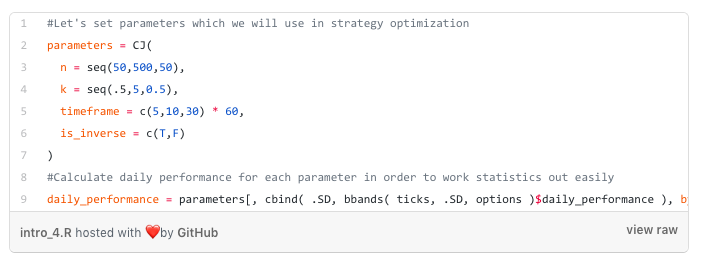
I expand Bollinger Bands strategy logic with a trigger that allows you to use inverse trades (go long instead of short and vice versa). Strategy code and example can be found here in order to replicate the results.

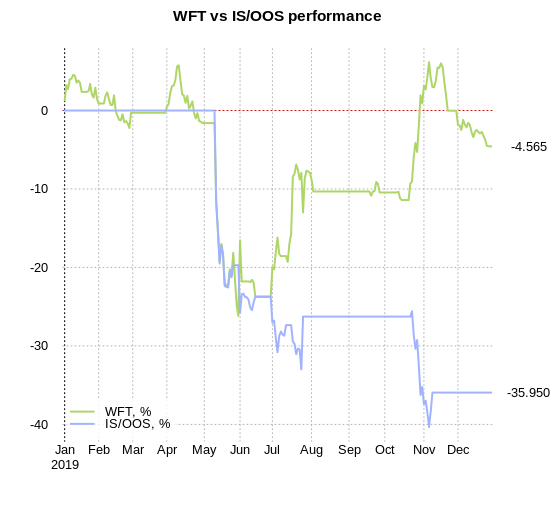
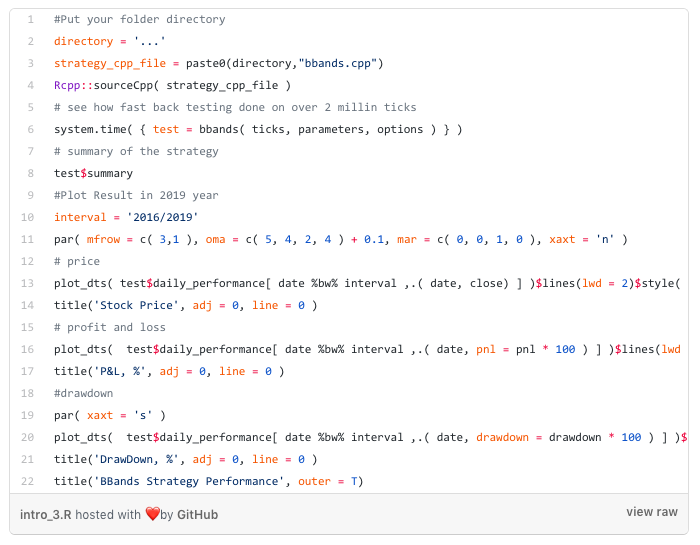
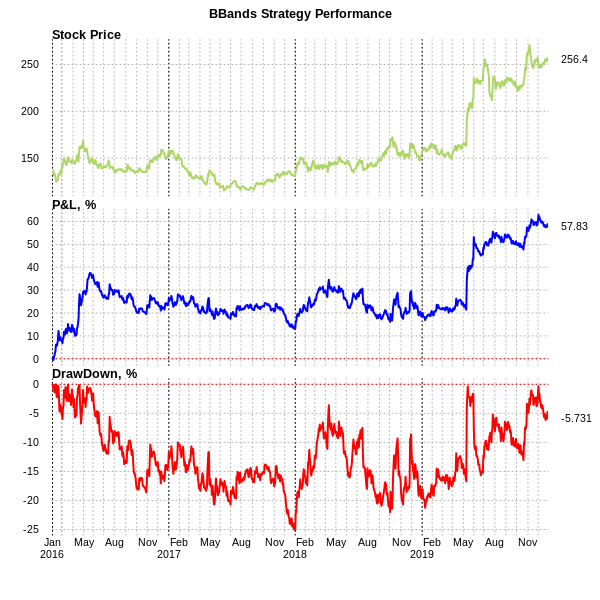
We will choose Gazprom stock downloaded from Finam data source from 2016 till the end of 2019; Sharpe Ratio optimization metric with zero interest rate and look at the strategy optimized for the 2016–2018 period and tested in 2019 period.
Set options and parameters for a strategy:
Backtest Bollinger Band Strategy on all period:
Strategy Performance calculated on daily statistics.
Let’s set strategy parameters and calculate daily performance for them:
And plot PnL heat-map for IS and OOS period:
Heatmap. PnL in IS and OOS periods at a different set of strategy parameters.
Calculate Sharpe Ratio and find the maximum on IS period:
The performance of that optimization below:
IS (2016–2018) / OOS(2019) Strategy Performance
As we can see we overfit our strategy parameters and choose the wrong one that allows us to lose all profit earned in the training period.
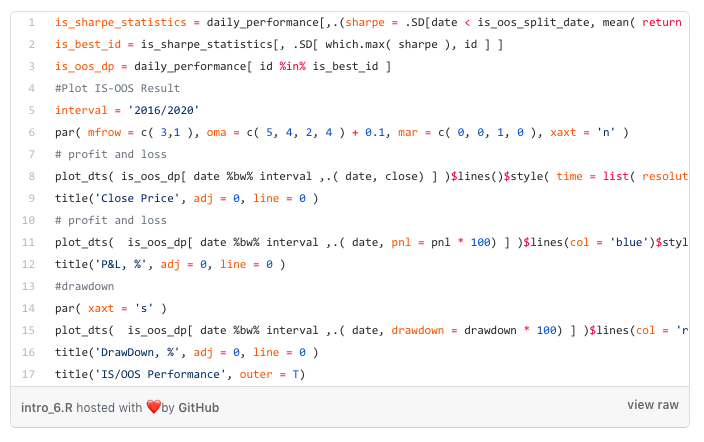
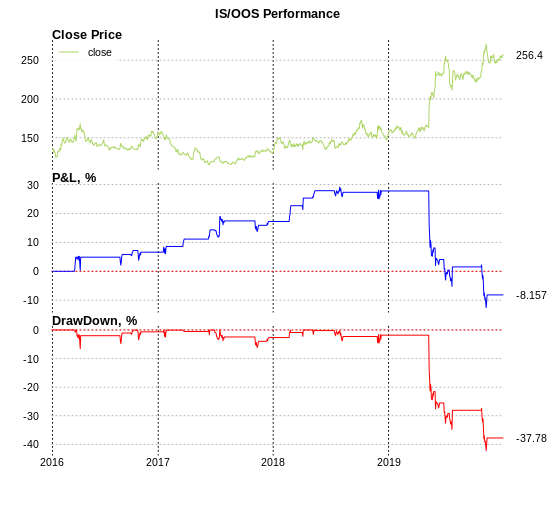
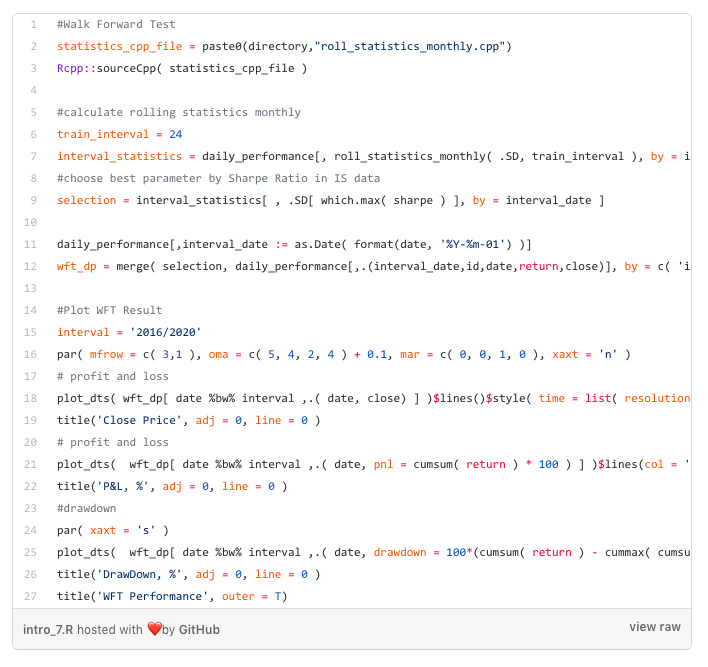
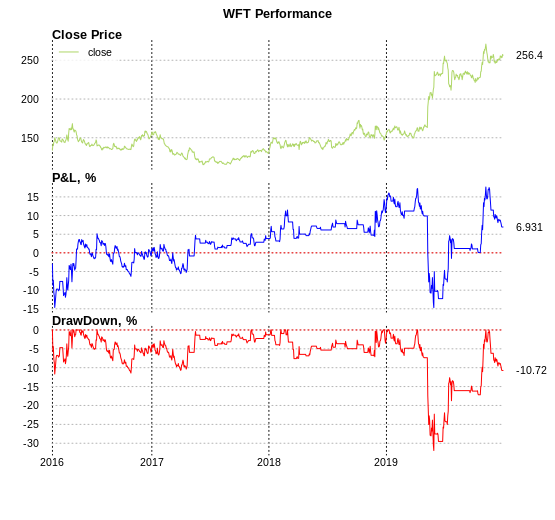
Now we move to Walk Forward Optimization. We will calculate rolling performance with 24 months window and collect best strategy parameters by Sharpe Ratio monthly on the 1st day of the month:
Walk Forward Performance with monthly optimization
And finally, let’s compare the performance of that 2 optimizations in 2019:
PnL Performance of two optimization approaches
So, as we can see we got more stable performance statistics in the Walk Forward Optimization approach. In such a way, we can estimate not only best strategy parameters but also hyperparameters of a Walk Forward such as optimization metric and length of the rolling window however you have to be careful to escape over-fitting in hyperparameters.